
Aug.25
Procedure: resuscitate HepG2 cells.
Aug.27
Procedure: Cell passage.
Aug.29
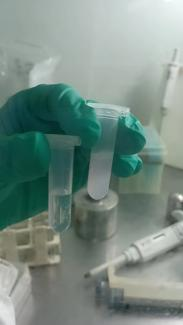
Procedure: Seeding cells in 96 well plates (6h group and 24h group) + cell passage+ Dissolve the pTrp-pHis in saline.
Aug.31
Procedure:
1.Replace the medium with 100μL DMEM containing 10%FBS and different concentration of pTrp-pHis(0,9,17,35,70,140,280μM).
2.Incubate 6h or 24h.
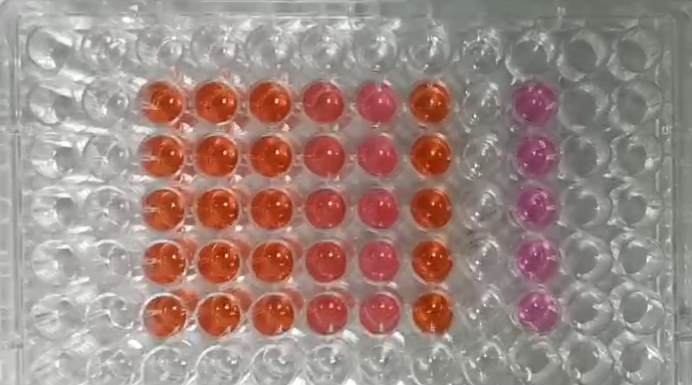
3.Add 10μL cck8 per well.
4.Incubate 2h.
5.Measure fluorescence intensity at an excitation wavelength of 450 nm.
Experimental results:
6h HepG2 pTrp-pHis | |||||||
μM | 0 | 9 | 17 | 35 | 70 | 140 | 280 |
3.048 | 2.937 | 3.025 | 2.889 | 2.813 | 2.539 | 2.114 | |
2.935 | 2.964 | 3.031 | 2.943 | 2.693 | 2.529 | 2.193 | |
3.042 | 2.943 | 2.97 | 2.842 | 2.794 | 2.492 | 3.028 | |
2.944 | 3.019 | 2.969 | 2.939 | 2.773 | 2.405 | 2.153 | |
2.917 | 2.984 | 2.945 | 2.88 | 2.77 | 2.463 | 2.059 | |
24h HepG2 pTrp-pHis | |||||||
μM | 0 | 9 | 17 | 35 | 70 | 140 | 280 |
3.218 | 3.263 | 3.218 | 3.187 | 3.218 | 3.143 | 3.111 | |
3.21 | 3.288 | 3.211 | 3.176 | 3.106 | 3.238 | 3.229 | |
3.177 | 3.238 | 3.289 | 3.285 | 3.279 | 3.316 | 3.262 | |
3.217 | 3.303 | 3.323 | 3.325 | 3.302 | 3.309 | 3.278 | |
3.268 | 3.301 | 3.284 | 3.235 | 3.214 | 3.114 | 3.226 | |
Results analysis: HepG2 has a tendency of cytotoxicity, and we believe that the concentration of peptides causing cytotoxicity is too high, so we need to find out the minimum cytotoxicity concentration, and the data in the 24h group is poor, we believe that there are too many cells per well, so we change the number of cells to 2000 per well.
Sep.2
Procedure: Seeding cells in 96 well plates (6h group and 24h group) + cell passage.
Sep.3
Procedure:
1.Replace the medium with 100μL DMEM containing 10%FBS and different concentration of pTrp-pHis(0,56,71,85,99,113,127,141μM).
2.Incubate 6h or 24h.
3.Add 10μL cck8 per well.
4.Incubate 2h.
5.Measure fluorescence intensity at an excitation wavelength of 450 nm.
Results:
6h HepG2 pTrp-pHis | ||||||||
μM | 0 | 56 | 71 | 85 | 99 | 113 | 127 | 141 |
0.887 | 0.806 | 0.722 | 0.77 | 0.738 | 0.661 | 0.573 | 0.552 | |
1.015 | 1.006 | 1.089 | 1.137 | 1.304 | 1.022 | 0.889 | 0.617 | |
1.037 | 1.067 | 1.244 | 1.284 | 1.307 | 1.215 | 1.071 | 0.699 | |
1.007 | 0.987 | 1.047 | 0.822 | 0.883 | 0.806 | 0.833 | 0.551 | |
24h HepG2 pTrp-pHis | ||||||||
μM | 0 | 56 | 71 | 85 | 99 | 113 | 127 | 141 |
2.382 | 2.185 | 2.165 | 1.932 | 1.796 | 1.481 | 1.594 | 1.581 | |
2.345 | 2.471 | 2.493 | 2.174 | 2.054 | 1.984 | 1.953 | 1.964 | |
2.532 | 2.663 | 2.672 | 2.519 | 2.727 | 2.672 | 2.279 | 1.851 | |
2.329 | 2.278 | 2.296 | 2.227 | 2.089 | 1.837 | 1.714 | 1.646 | |
Results analysis: We believe that pTrp-pHis began to show cytotoxicity at 150ng/μL. We find that the measurement method of absorbance is wrong, pTrp-pHis should be mixed into DMEM medium to make concentration gradient instead of directly adding pTrp-pHis of equal concentration to DMEM medium (different volumes affect the absorbance value) 2. The method of dissolving pTrp-pHis was considered to be wrong, and DMEM medium (with serum) was used instead of normal saline.
Sep.5
Procedure: Seeding cells in 96 well plates(6h group and 24h group) + cell passage.
Sep.6
Procedure:
1.Dissolve pTrp-pHis in the medium (with serum).
2.Replace the medium with 100μL DMEM containing 10%FBS and different concentration of pTrp-pHis(0,56,71,85,99,113,127,141,280μM).
3.Incubate 6h or 24h.
3.Add 10μL cck8 per well.
4.Incubate 2h.
5.Measure fluorescence intensity at an excitation wavelength of 450 nm.
Results analysis:
1.There was no trend of cytotoxicity in the obtained data, we found that pTrp-pHis would precipitate in the medium (with serum). We believe that DEME medium with serum would affect the stability of the pTrp-pHis and lead to precipitation, so we decide to use the serum-free medium to dissolve pTrp-pHis.
2.We decide to change the concentration gradient to get a better result.
Sep.8
Procedure:Seeding cells in 96 well plates(6h group and 24h group) + cell passage
Sep.9
Procedure:
1.Dissolve pTrp-pHis in the medium (without serum).
2.Replace the medium with 100μL DMEM medium containing different concentration of pTrp-pHis(0,6,56,280,564μM).
3.Incubate 6h or 24h.
3.Add 10μL cck8 per well.
4.Incubate 2h.
5.Measure fluorescence intensity at an excitation wavelength of 450 nm.
Result analysis:
There was no trend of cytotoxicity in the obtained data, we also found that pTrp-pHis would precipitate in the medium (without serum). We decide to dissolve pTrp-pHisin saline.
Sep.11
Procedure: Seeding cells in 96 well plates (6h group and 24h group) + cell passage.
Sep.12
Procedure:
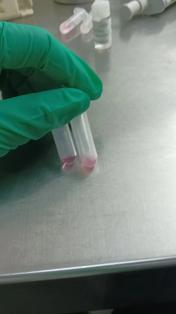
1.Dissolve pTrp-pHis in the saline.
2.Replace the medium with 100μL DMEM containing different concentration of pTrp-pHis(0,6,56,280,564μM).
3.Incubate 6h or 24h.
3.Add 10μL cck8 per well.
4.Incubate 2h.
5.Measure fluorescence intensity at an excitation wavelength of 450 nm.
Result analysis: There was no cytotoxic trend in the obtained data, and precipitation was found after the normal saline drug was added to DMEM medium, we decide to add DMSO to increase the solubility of pTrp-pHis.
Sep.14
Procedure:Seeding cells in 96 well plates(6h group and 24h group) + cell passage.
Sep.15
Procedure:
Add DMSO to dissolve pTrp-pHis.
Result:
Dissolve in DMEM medium (without serum) and 2% DMSO.
pTrp-pHis concentration:280uM
Dissolve in DMEM medium (without serum).
pTrp-pHis concentration:280uM
Dissolve in 1640 medium (without serum).
pTrp-pHis concentration:280uM
Results analysis:pTrp-pHis precipitate in DMEM medium and 1640 medium,adding DMSO can’t dissolve it.
Sep.17
Procedure:Seeding cells in 96 well plates(6h group and 24h group) + cell passage.
Sep.18
Procedure:
1.Dissolve the drug in the saline.
2.Replace the medium with 100μL DMEM containing different concentration of pTrp-pHis(0,6,56,280,564μM).
3.Incubate 6h or 24h.
3.Add 10μL cck8 per well.
4.Incubate 2h.
5.Measure fluorescence intensity at an excitation wavelength of 450 nm.
Results analysis:
There was no cytotoxicity trend in the data obtained, We think the cytotoxicity of pTrp-pHis will response to different pH. We believe pTrp-pHis’s solubility and cytotoxicity will increase at low pH. So we decide to dissolve pTrp-pHis in low pH solution.
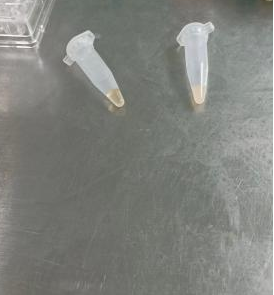
(Insoluble pTrp-pHis sediment)
Sep.20
1.Procedure: Seeding cells in 96 well plates (6h group and 24h group) + cell passage
2.Add 4μL 6M HCl to DMEM medium to set pH to 6.5.
Results:
 pH=6.5 DMEM medium
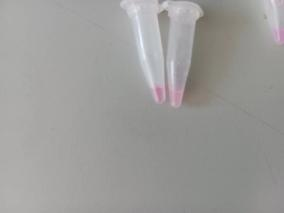 pH=7.4 DMEM medium
Results analysis:
pTrp-pHis was still insoluble in low pH medium.
Sep.21
Procedure:
1.Dissolve pTrp-pHis in the saline.
2.Replace the medium with 100μL DMEM containing different concentration of pTrp-pHis(0,8,17,35,70,140,280μM).
3.Incubate 6h or 24h.
3.Add 10μL cck8 per well.
4.Incubate 2h.
5.Measure fluorescence intensity at an excitation wavelength of 450 nm.
Results analysis: There was no cytotoxicity trend in the data obtained, we found sediment in the bottom of well when we remove the medium. We believe the sediment will affect the measurement of absorbance. But the absorbance of the medium indicates a cytotoxic trend. We decide to repeat the experiment and due to the poor result of 24h group we decide to remove it.
Sep.23
1.Procedure: Seeding cells in 96 well plates(pH=6.5 group and pH=7.4 group) + cell passage
Sep.24
1.Dissolve pTrp-pHis in the saline.
2.Replace the medium with 100μL DMEM containing different concentration of pTrp-pHis(0,8,17,35,70,140,280μM).
3.Incubate 6h.
3.Add 10μL cck8 per well.
4.Incubate 2h.
5.Measure fluorescence intensity at an excitation wavelength of 450 nm.
Results:
pH=6.5 HepG2 pTrp-pHis | |||||||
μM | 0 | 8 | 17 | 35 | 70 | 140 | 280 |
0.192 | 0.19 | 0.209 | 0.183 | 0.205 | 0.166 | 0.168 | |
0.223 | 0.231 | 0.219 | 0.215 | 0.213 | 0.186 | 0.171 | |
0.218 | 0.212 | 0.21 | 0.199 | 0.187 | 0.166 | 0.143 | |
0.229 | 0.227 | 0.226 | 0.206 | 0.202 | 0.185 | 0.151 | |
0.211 | 0.199 | 0.189 | 0.191 | 0.186 | 0.159 | 0.146 | |
pH=7.4 HepG2 pTrp-pHis | |||||||
μM | 0 | 8 | 17 | 35 | 70 | 140 | 280 |
0.161 | 0.142 | 0.187 | 0.188 | 0.179 | 0.17 | 0.149 | |
0.2 | 0.207 | 0.208 | 0.216 | 0.2 | 0.169 | 0.15 | |
0.204 | 0.205 | 0.199 | 0.199 | 0.199 | 0.164 | 0.144 | |
0.213 | 0.198 | 0.21 | 0.217 | 0.182 | 0.194 | 0.152 | |
0.206 | 0.199 | 0.219 | 0.193 | 0.207 | 0.161 | 0.14 | |
Results analysis:
The data showed a cytotoxicity trend, and the drug did respond to pH, but the error bar was longer. It was suggested that PBS with different p could be used instead of serum-free medium.
Sep.27
Procedure: Seeding cells in 96 well plates (pH=6.5 group and pH=7.4 group) + cell passage.
Sep.28
Procedure:
1.Dissolve pTrp-pHis in the saline.
2.Replace the medium with 100μL PBS (pH=6.5 or pH=7.4) containing different concentration of (0,8,17,35,70,140,280μM).
3.Incubate 6h.
3.Add 10μL cck8 per well.
4.Incubate 2h.
5.Measure fluorescence intensity at an excitation wavelength of 450 nm.
Results:
pH=6.5 HepG2 pTrp-pHis | |||||||
μM | 0 | 8 | 17 | 35 | 70 | 140 | 280 |
0.089 | 0.12 | 0.061 | 0.107 | 0.08 | 0.086 | 0.082 | |
0.11 | 0.143 | 0.142 | 0.124 | 0.091 | 0.092 | 0.108 | |
0.097 | 0.129 | 0.134 | 0.102 | 0.08 | 0.083 | 0.083 | |
0.101 | 0.138 | 0.145 | 0.132 | 0.091 | 0.126 | 0.101 | |
0.091 | 0.133 | 0.129 | 0.105 | 0.083 | 0.079 | 0.09 | |
pH=7.4 HepG2 pTrp-pHis | |||||||
μM | 0 | 8 | 17 | 35 | 70 | 140 | 280 |
0.382 | 0.382 | 0.324 | 0.324 | 0.208 | 0.152 | 0.107 | |
0.282 | 0.282 | 0.338 | 0.338 | 0.181 | 0.128 | 0.078 | |
0.36 | 0.36 | 0.321 | 0.321 | 0.187 | 0.146 | 0.108 | |
0.329 | 0.329 | 0.258 | 0.258 | 0.174 | 0.13 | 0.084 | |
0.332 | 0.332 | 0.299 | 0.299 | 0.143 | 0.16 | 0.1 | |
Results analysis: The effect of PBS was not ideal, especially the cell viability of the pH=6.5 group with a concentration of 0 was low, and the trend of cytotoxicity of the pH=7.5 group was poor. We decide to repeat the experiment.
Oct.1
Procedure: Seeding cells in 96 well plates(pH=6.5 group and pH=7.4 group) + cell passage.
Oct.2
Procedure:
1.Dissolve pTrp-pHis in the saline.
2.Replace the medium with 100μL PBS (pH=6.5 or pH=7.4) containing different concentration of pTrp-pHis (0,8,17,35,70,140,280μM).
3.Incubate 6h.
3.Add 10μL cck8 per well.
4.Incubate 2h.
5.Measure fluorescence intensity at an excitation wavelength of 450 nm.
Results analysis: The results of this experiment showed no trend of cytotoxicity, and the overall cell viability was low. It was considered that PBS was not appropriate and would reduce cell viability. Due to time constraints, it was decided to use serum-free medium data.
Oct.4
Procedure: cell passage
Oct.6
Procedure: cell passage
Oct.9
Procedure: Seeding cells in 96 well plates(pH=6.5 group and pH=7.4 group) + cell passage.
Oct.10
Procedure:
1.Dissolve pTrp-pHis-PLGLAG-PEG8 in the saline.
2.Replace the medium with 100μL DMEM medium containing 10% serum and different concentration of pTrp-pHis-PLGLAG-PEG8(0,8,17,35,70,140,280μM).
3.Incubate 6h.
3.Add 10μL cck8 per well.
4.Incubate 2h.
5.Measure fluorescence intensity at an excitation wavelength of 450 nm.
Results:
pH=6.5 HepG2 pTrp-pHis-PLGLAG-PEG8 | |||||||
μM | 0 | 8 | 17 | 35 | 70 | 140 | 280 |
0.214 | 0.22 | 0.219 | 0.218 | 0.24 | 0.236 | 0.244 | |
0.234 | 0.234 | 0.242 | 0.24 | 0.258 | 0.263 | 0.248 | |
0.221 | 0.231 | 0.234 | 0.239 | 0.245 | 0.248 | 0.244 | |
0.218 | 0.231 | 0.236 | 0.24 | 0.251 | 0.256 | 0.245 | |
0.223 | 0.223 | 0.225 | 0.223 | 0.213 | 0.251 | 0.236 | |
pH=7.4 HepG2 pTrp-pHis-PLGLAG-PEG8 | |||||||
μM | 0 | 8 | 17 | 35 | 70 | 140 | 280 |
0.256 | 0.279 | 0.247 | 0.278 | 0.282 | 0.304 | 0.311 | |
0.297 | 0.283 | 0.283 | 0.275 | 0.303 | 0.311 | 0.32 | |
0.282 | 0.264 | 0.28 | 0.268 | 0.282 | 0.293 | 0.312 | |
0.295 | 0.261 | 0.29 | 0.275 | 0.263 | 0.301 | 0.317 | |
0.283 | 0.273 | 0.273 | 0.26 | 0.27 | 0.284 | 0.309 | |
Results Analysis: pTrp-pHis-PLGLAG-PEG8 showed almost no cytotoxicity in the presence of serum. Literature review revealed that serum could enhance the stability of pTrp-pHis-PLGLAG-PEG8, so we decided to explore the cytotoxicity of pTrp-pHis-PLGLAG-PEG8 without serum.
Oct.12
Procedure: Seeding cells in 96 well plate 96-well plates (pH=6.5 group and pH=7.4 group) + cell passage.
Oct.13
Procedure:
1.Dissolve pTrp-pHis-PLGLAG-PEG8 in the saline.
2.Replace the medium with 100μL DMEM medium containing different concentration of pTrp-pHis-PLGLAG-PEG8(0,8,17,35,70,140,280μM).
3.Incubate 6h.
3.Add 10μL cck8 per well.
4.Incubate 2h.
5.Measure fluorescence intensity at an excitation wavelength of 450 nm.
Results:
pH=7.4 | |||||||
μM | 0 | 8 | 17 | 35 | 70 | 140 | 280 |
0.69 | 0.661 | 0.646 | 0.628 | 0.585 | 0.617 | 0.456 | |
0.666 | 0.642 | 0.641 | 0.678 | 0.621 | 0.622 | 0.425 | |
0.678 | 0.656 | 0.647 | 0.642 | 0.59 | 0.62 | 0.481 | |
0.692 | 0.658 | 0.656 | 0.619 | 0.612 | 0.626 | 0.458 | |
0.669 | 0.636 | 0.635 | 0.646 | 0.654 | 0.592 | 0.368 | |
pH=6.5 | |||||||
μM | 0 | 8 | 17 | 35 | 70 | 140 | 280 |
0.453 | 0.472 | 0.441 | 0.408 | 0.395 | 0.284 | 0.205 | |
0.474 | 0.458 | 0.444 | 0.436 | 0.386 | 0.288 | 0.221 | |
0.465 | 0.44 | 0.447 | 0.429 | 0.373 | 0.29 | 0.207 | |
0.445 | 0.458 | 0.431 | 0.406 | 0.373 | 0.293 | 0.21 | |
0.462 | 0.426 | 0.393 | 0.407 | 0.354 | 0.272 | 0.196 | |
Results analysis: In the absence of serum, pTrp-pHis-PLGLAG-PEG8 showed a small amount of cytotoxicity and pH responsiveness.
Oct.15
Procedure: Seeding cells in 96 well plate 96-well plates+ cell passage.
MMP-2 enzyme activation:Dilute rhMMP-2 to 100 µg/mL in DEPC-Treated water. Activate rhMMP-2 by adding APMA to a final concentration of 1 mM. Then incubate the mixture at 37 °C for 1 hour. Frozen at minus 20 degrees.
Oct.16
Procedure:
1.Dissolve pTrp-pHis-PLGLAG-PEG8 in the saline.
2.Replace the medium with 100μL DMEM medium containing MMP-2 and pTrp-pHis-PLGLAG-PEG8(control, MMP-2 enzyme group, MMP-2 enzyme +140μM pTrp-pHis-PLGLAG-PEG8 group, 140μM pTrp-pHis-PLGLAG-PEG8 group, 140μM pTrp-pHis group, MMP-2 enzyme +280μM pTrp-pHis-PLGLAG-PEG8 group, 280μM
pTrp-pHis-PLGLAG-PEG8 group, 280μM pTrp-pHis group).
3.Incubate 6h.
3.Add 10μl cck8 per well.
4.Incubate 2h.
5.Measure fluorescence intensity at an excitation wavelength of 450 nm.
Results:
control | MMP-2 | 140μM pTrp-pHis-PLGLAG-PEG8 | MMP-2+140μM pTrp-pHis-PLGLAG-PEG8 | 140μM pTrp-pHis | 280μM pTrp-pHis-PLGLAG-PEG8 | MMP-2+80μM pTrp-pHis-PLGLAG-PEG8 | 280μM pTrp-pHis |
0.408 | 0.508 | 0.284 | 0.272 | 0.351 | 0.205 | 0.195 | 0.241 |
0.431 | 0.552 | 0.288 | 0.262 | 0.366 | 0.221 | 0.192 | 0.267 |
0.442 | 0.532 | 0.29 | 0.273 | 0.36 | 0.207 | 0.178 | 0.23 |
0.476 | 0.509 | 0.293 | 0.286 | 0.366 | 0.21 | 0.19 | 0.272 |
0.48 | 0.522 | 0.272 | 0.265 | 0.34 | 0.196 | 0.197 | 0.26 |
Results Analysis: pTrp-pHis-PLGLAG-PEG8 toxicity was enhanced by enzyme digestion, but the effect was not obvious.