Aug.18
Procedure:
1.Use 1/100,000 electronic balance to weigh 20.0mg pTrp-pHis-PLGLAG-PEG8, and dissolve in about 1mL THF.
2.The dissolved pTrp-pHis-PLGLAG-PEG8 was then dripped into a 20mL glass vial with 10mL stirring ultrapure water.
3.The solution was subjected to 30minutes of ultrasonication and keep stirring under room temperature overnight.
Aug.19
Procedure:
1.The incubated solution was pelleted after 5 minutes ultrasonication.
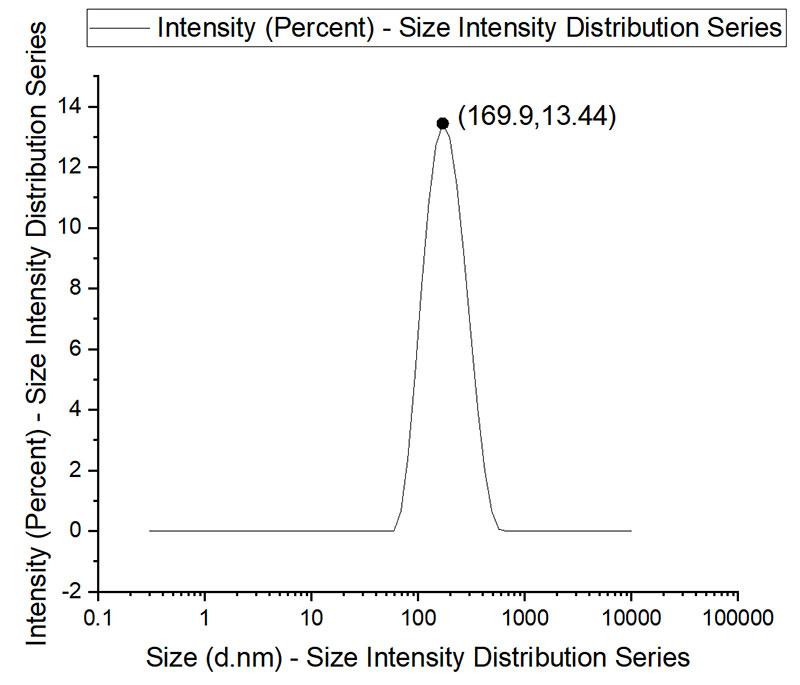
2.The supernatant was used for Dynamic Light Scattering (Malvern Zetasizer Nano ZS (Malvern Instruments, U.K.)).
Aug.23
Procedure:
1.Use 1/100,000 electronic balance to weigh 1.49mg pTrp-pHis-PLGLAG-PEG8 and 1.09mg pTrp-pHis, decant in two 5mL cryovials. Then each were dissolved with a given volume PBS (0.01M pH7.4 ), supposing to achieve the concentration of 0.141 mM.
2.The solution was subjected to 30 minutes of ultrasonication and incubated under room temperature for 12h.
Aug.24
Procedure:
1.The incubated solution was pelleted after 5 minutes ultrasonication.
2.The supernatant was used for Dynamic Light Scattering.
Results:
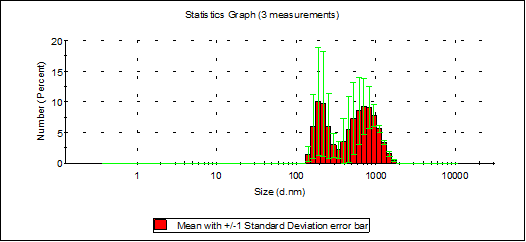
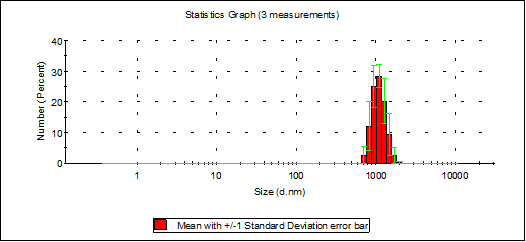
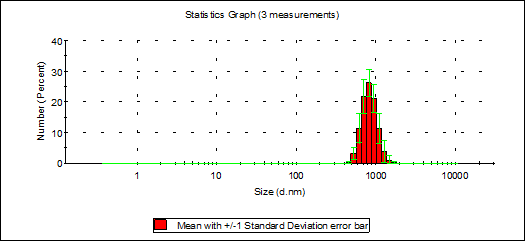
Number stats graph of PBS, pTrp-pHis-PLGLAG-PEG8 (12h 0.141 mM pH7.4)
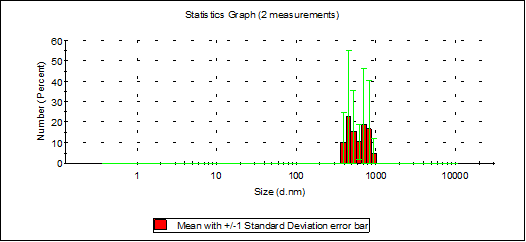
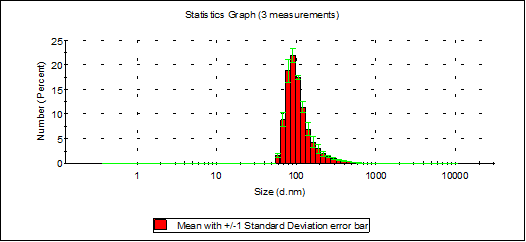
Number stats graph of PBS, pTrp-pHis (12h 0.141 mM pH7.4)
Results analysis:
We can get a noticeable peak from the Statistics Graph derived from the sample made by pTrp-pHis-PLGLAG-PEG8. But we can only get an unstable, after-averaging peak from the Statistics Graph derived from the sample pTrp-pHis.
Sep.5
Procedure:
1.Use 1/100,000 electronic balance to weigh 0.91, 0.92mg pTrp-pHis-PLGLAG-PEG8, decant in two 5mL cryovials. Then each were dissolved with a given volume of water then adjust the pH value to 7.4(sample 1) and 6.5(sample 2) with sodium hydroxide and hydrochloric acid, supposing to achieve the concentration of 0.085 mM.
2.The solution was subjected to 30 minutes of ultrasonication and incubated under room temperature for 12h.
Sep.6
Procedure:
1.The incubated solution was pelleted after 5 minutes ultrasonication.
2.The supernatant was used for Dynamic Light Scattering.
3.Adjust the sample 1’s pH value to 6.5 with sodium hydroxide(sample 3).
Results:

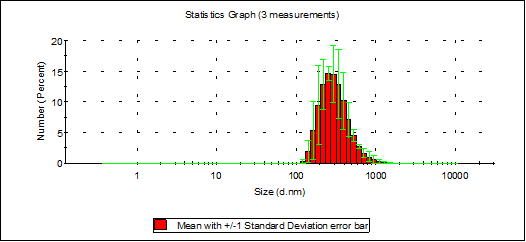
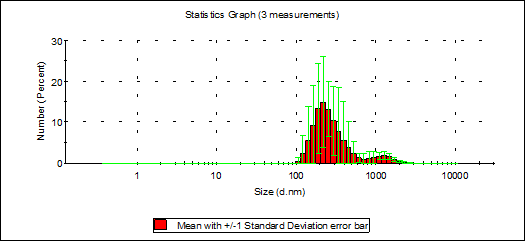
Number stats graph of Sample 1
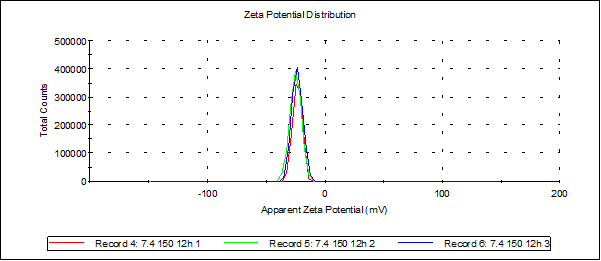
Zeta potential of sample 2
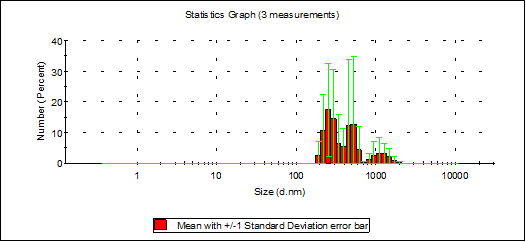
Number stats graph of sample 2
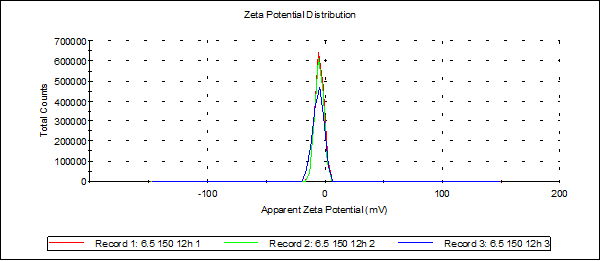
Zeta potential of sample 2
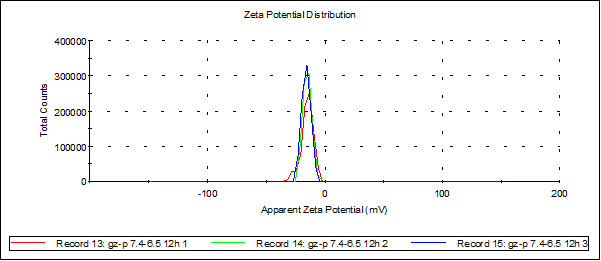
Zeta potential of sample 3
Sep.13
Procedure:
1.Use 1/100,000 electronic balance to weigh 0.31, 0.61, 0.92, 1.22, 1.51mg pTrp-pHis-PLGLAG-PEG8, decant into four 5mL cryovials. Then each were dissolved with a given volume PBS (0.01M pH7.4), supposing to achieve the concentration of 0.028, 0.056, 0.085, 0.113, 0.141 mM.
2.The solution was subjected to 30 minutes of ultrasonication and incubated under room temperature for 12h.
Sep.14
Procedure:
1.The incubated solution was pelleted after 5 minutes ultrasonication.
2.The supernatant was used for Dynamic Light Scattering.
Results:
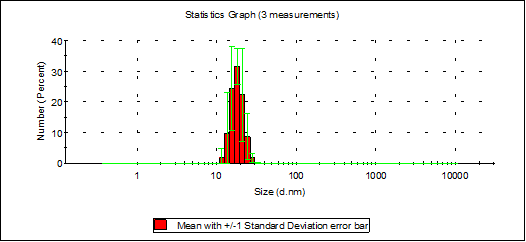
Number stats graph of PBS, pTrp-pHis-PLGLAG-PEG8(12h 0.028 mM pH7.4)
Number stats graph of PBS, pTrp-pHis-PLGLAG-PEG8(12h 0.056 mM pH7.4)
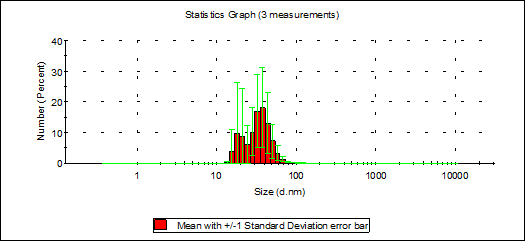
Number stats graph of PBS, pTrp-pHis-PLGLAG-PEG8(12h 0.085 mM pH7.4)
Number stats graph of PBS, pTrp-pHis-PLGLAG-PEG8 (12h 0.113 mM pH7.4)
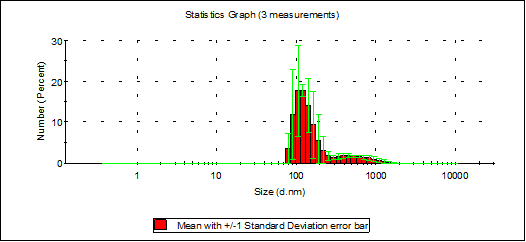
Number stats graph of PBS, pTrp-pHis-PLGLAG-PEG8(12h 0.141 mM pH7.4)
Sep.26
Procedure:
1.Use 1/100,000 electronic balance to weigh 0.92mg pTrp-pHis-PLGLAG-PEG8, decant into a cryovial. Then dissolved it with PBS (0.01M pH6.5), supposing to achieve the concentration of 0.085 mM.
2.The solution was subjected to 30 minutes of ultrasonication, incubated under room temperature. Sampling 1mL every 6h, pellet after 5 minutes ultrasonication, used for DLS.
Results:
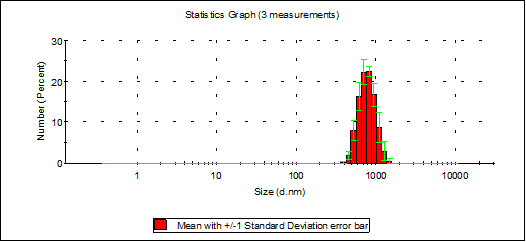
Number stats graph of PBS, pTrp-pHis-PLGLAG-PEG8 (6h 0.085 mM pH6.5)
Number stats graph of PBS, pTrp-pHis-PLGLAG-PEG8 (12h 0.085 mM pH6.5)
Number stats graph of PBS, pTrp-pHis-PLGLAG-PEG8 (18h 0.085 mM pH6.5)
Number stats graph of PBS, pTrp-pHis-PLGLAG-PEG8 (24h 0.085 mM pH6.5)
Sep.27
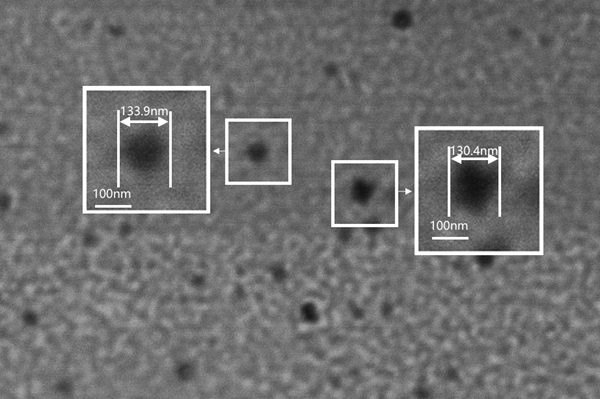
pTrp-pHis-PLGLAG-PEG was dissolved in PBS (0.01M, pH 7.4) at a concentration of 141.1 μM. The solution was then subjected to 30 minutes of ultrasonication and incubated overnight. Clean the silicon wafer with oxygen plasma for 1-3 minutes. Several drops of the polymeric micellar solution are deposited on the surface of the treated silicon wafer for 1.5 hours. Then the sample is placed in a vacuum dryer for about 1-2 hours to allow the droplets to dry completely and visualized by SEM (JLU SKLSHM Magellan400, America).
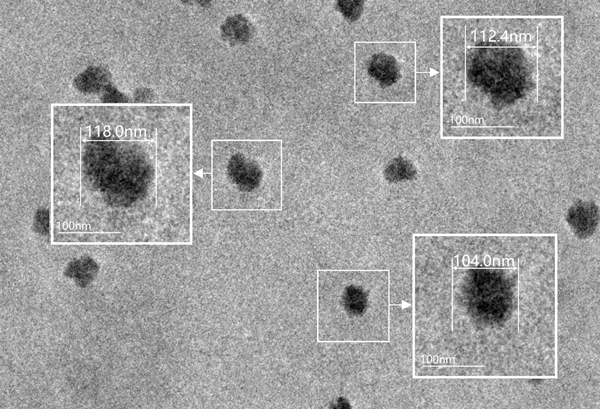
Sep.27
pTrp-pHis-PLGLAG-PEG was dissolved in PBS (0.01M, pH 7.4) at a concentration of 141.1 μM. The solution was then subjected to 30 minutes of ultrasonication and incubated overnight. TEM images were acquired on a JEOL JEM-2100F electron microscope at an operating voltage of 200 kV. 10 microliter of the polymeric micellar solution was deposited onto a carbon-coated copper grid and then air-dried completely.